This data analysis merges NCAA, International and NBA data pulled from several sources to create a big board of draft prospects by a machine-learning process called K-Nearest-Neighbours to find the closest statistical neighbours for each prospect. Before a prospect enters the NBA, they can develop into several outcomes and the neighbours’ NCAA, International and NBA production and statistical nearness to the prospect will be used to forecast each prospect’s projection as NBA star, starter, rotation or fringe players.
1. Data Sources
This data analysis of NCAA prospects will utilize and merge data from the following sources:
Barttorvik data: https://barttorvik.com/playerstat.php?year=all
NBA combine data: https://www.nba.com/stats/draft/combine-anthro
Basketball Reference data: https://www.basketball-reference.com
Tankathon data: https://www.tankathon.com/
RealGM data: https://basketball.realgm.com/international/stats
2. Data Inputs
From this data, the prospects will be analyzed in several areas:
Draft Age
Rookie players will be at a large age and experience disadvantage in the NBA. Young NCAA prospects experience this on a smaller level in the NCAA.
Physical Tools
Standardized measurement at the NBA combine such as: height without shoes and wingspan. Unfortunately most of the top prospects in previous years did not participate in combine testing, but starting from 2024, draft prospects are required to participate. The upcoming draft prospects’ physical tools will be compared with previous draft prospects in the NBA.com database.
These are the guard, wing and big combine measurements star players that prospects will be expected to emulate on offence and stop on defence.
Historical Draft Class Starter and Rotation Players analysis
The number of expected starters and rotation players within a draft class is about 14 starters and 26 rotation players. This will be taken into account when analyzing prospects and their potential NBA role.
NCAA Statistical Production
how the draft prospects and previously drafted players produced in their final NCAA year
separate analysis for production vs top100 opponents as NCAA schedules differ amongst teams. This filters for the highest NCAA competition as a closer analogue to NBA competition the prospect will experience once drafted.
NBA Statistical Production
how previously drafted NCAA prospects produced in the NBA and how it compares to their NCAA production
the correlation of NCAA stat to NBA stat can be found at:
Nearest Statistical Neighbours
The nearest statistical neighbours to each NCAA draft prospect will be identified and their NBA statistical production used to project how well their NCAA production will translate to the NBA. The differences between the draft prospect and their statistical neighbours will be analyzed to infer why a draft prospect may have better or worse NBA production than their neighbours.
3. Data Output
Prospect Statistical Profile and Analysis
Before a prospect is drafted into the NBA, there is a range of potential outcomes depending on their development. This analysis will use the data inputs mentioned to attempt to project their NBA outcomes based on the NBA production of their statistical nearest neighbours.
Prospect Big Board
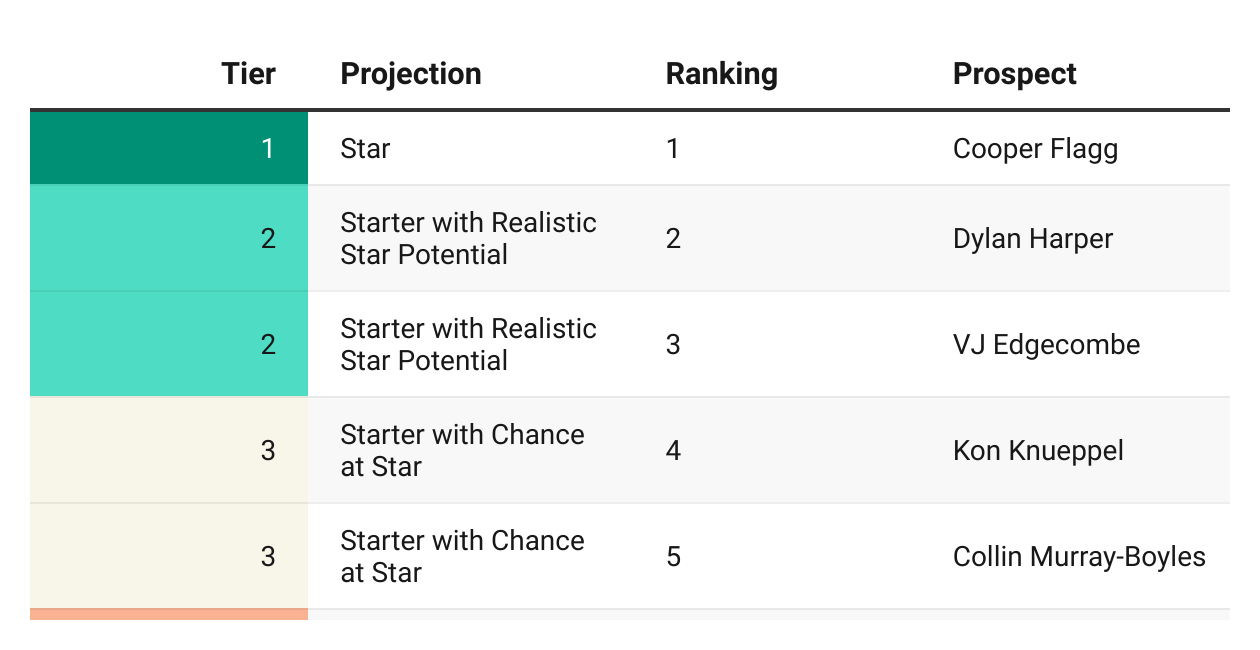
Prospects will be ranked in order in terms of NBA potential and role as star, starter, rotation, or fringe players.
2025 NBA Draft Prospect Big Board
My very 1st big board is a ranking of the NCAA prospects on their potential NBA roles as star, starter, rotation, or fringe players accounting for the value of their role (lead scorer, lead playmaker, 3 and D, rim protector etc.) and my perceived likelihood of their reaching that potential. The development will undoubtedly depend on the prospect and the…


